A single H2S reading taken at 2 PM on a Tuesday tells you what the gas composition was at 2 PM on a Tuesday. It does not tell you what happened at 3 AM when ambient temperatures dropped and lagoon turnover shifted the sulfate balance, or what will happen Thursday when a slug load of high-sulfur substrate hits the digester. Most biogas system failures that EFI investigates trace back to H2S excursions that occurred between spot checks.
Over three decades of building and maintaining covered lagoon digesters and biogas collection systems, we have seen the same pattern repeatedly: an operator takes weekly or biweekly H2S readings, sees acceptable numbers, and assumes the system is running within tolerance. Then a flare nozzle corrodes through, an engine catalyst fails, or a gas compressor bearing seizes. The post-mortem reveals H2S spikes of 5,000 to 8,000 ppm lasting four to six hours at a time, invisible to any periodic sampling program.
What Continuous Monitoring Actually Measures
Continuous H2S monitoring means a fixed sensor sampling the biogas stream every 30 to 120 seconds and logging each reading. The resulting dataset reveals three things that spot checks cannot: baseline concentration patterns over 24-hour and seasonal cycles, the frequency and magnitude of transient spikes, and the correlation between H2S levels and operational variables like feed rate, temperature, and O2 injection dosing.
The baseline pattern alone is valuable. In covered lagoon systems, H2S concentration typically follows a diurnal curve tied to lagoon temperature. As the cover surface warms through the afternoon, increased biological activity in the liquid phase generates more sulfide. Overnight cooling slows the process. Knowing this pattern allows operators to time maintenance activities, adjust O2 injection schedules, and set meaningful alarm thresholds rather than relying on a single number from a spec sheet.
Sensor Technologies for Biogas H2S
Three sensor technologies dominate continuous H2S monitoring in biogas applications. Each has distinct trade-offs in accuracy, lifespan, and maintenance requirements.
Electrochemical sensors are the most common and least expensive option. A typical electrochemical H2S cell costs $200 to $500 and measures concentrations from 0 to 500 ppm with reasonable accuracy. The limitation is range: most biogas streams run 1,000 to 5,000 ppm H2S, well above the cell's measurement ceiling. Electrochemical sensors work well downstream of treatment (after O2 injection or scrubbing) where residual H2S is in the 50 to 200 ppm range. They are not suitable for raw biogas monitoring. Cell life is typically 12 to 24 months before replacement is required.
Metal oxide semiconductor (MOS) sensors handle higher concentration ranges, typically 0 to 10,000 ppm. They are more durable than electrochemical cells and tolerate the moisture and contaminants common in raw biogas. However, MOS sensors exhibit significant cross-sensitivity to other sulfur compounds and to methane itself. Accuracy at the specific ppm level is lower than electrochemical sensors, but for trend monitoring and alarm triggering in raw biogas applications, they are a practical choice. Expect a sensor life of two to three years with periodic calibration.
Tunable diode laser absorption spectroscopy (TDLAS) analyzers offer the highest accuracy and longest service life but at a significantly higher price point. A TDLAS analyzer for H2S typically costs $8,000 to $15,000 installed, compared to $1,000 to $3,000 for a MOS-based system. The advantage is true measurement accuracy across the full range, no consumable sensor elements, and minimal cross-sensitivity. For sites with multiple gas streams or where biogas is being upgraded for pipeline injection, the investment in TDLAS is justified. For a single covered lagoon flaring application, it is usually not.
Placement: Where You Put the Sensor Matters More Than Which Sensor You Buy
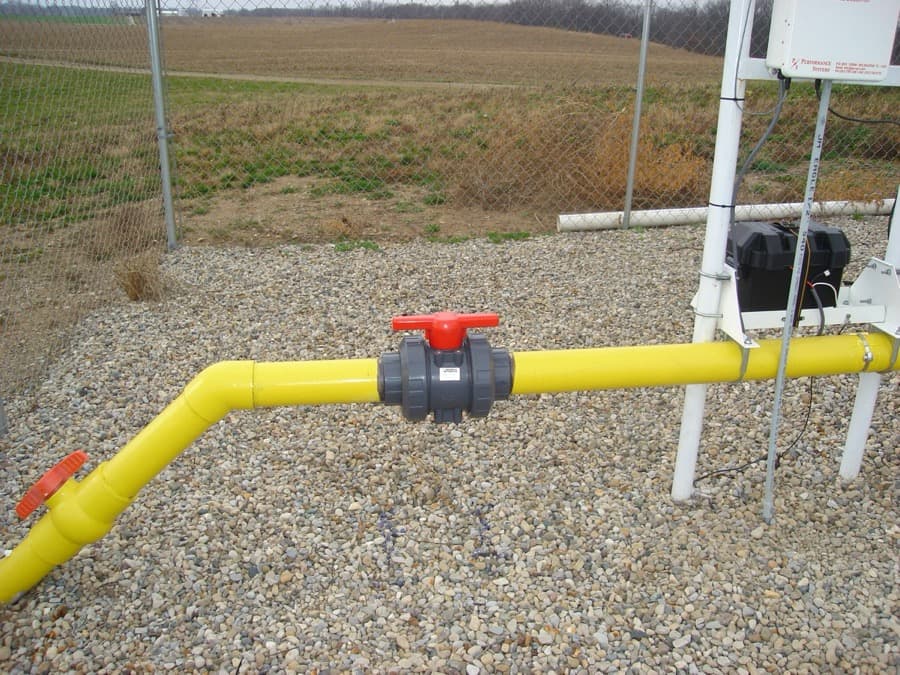
A common mistake is installing a single sensor at the most accessible point in the gas train and assuming it represents the entire system. In a covered lagoon with multiple gas collection laterals feeding a common header, H2S concentration can vary by 2,000 ppm or more between collection zones depending on sludge depth, substrate loading, and cover geometry.
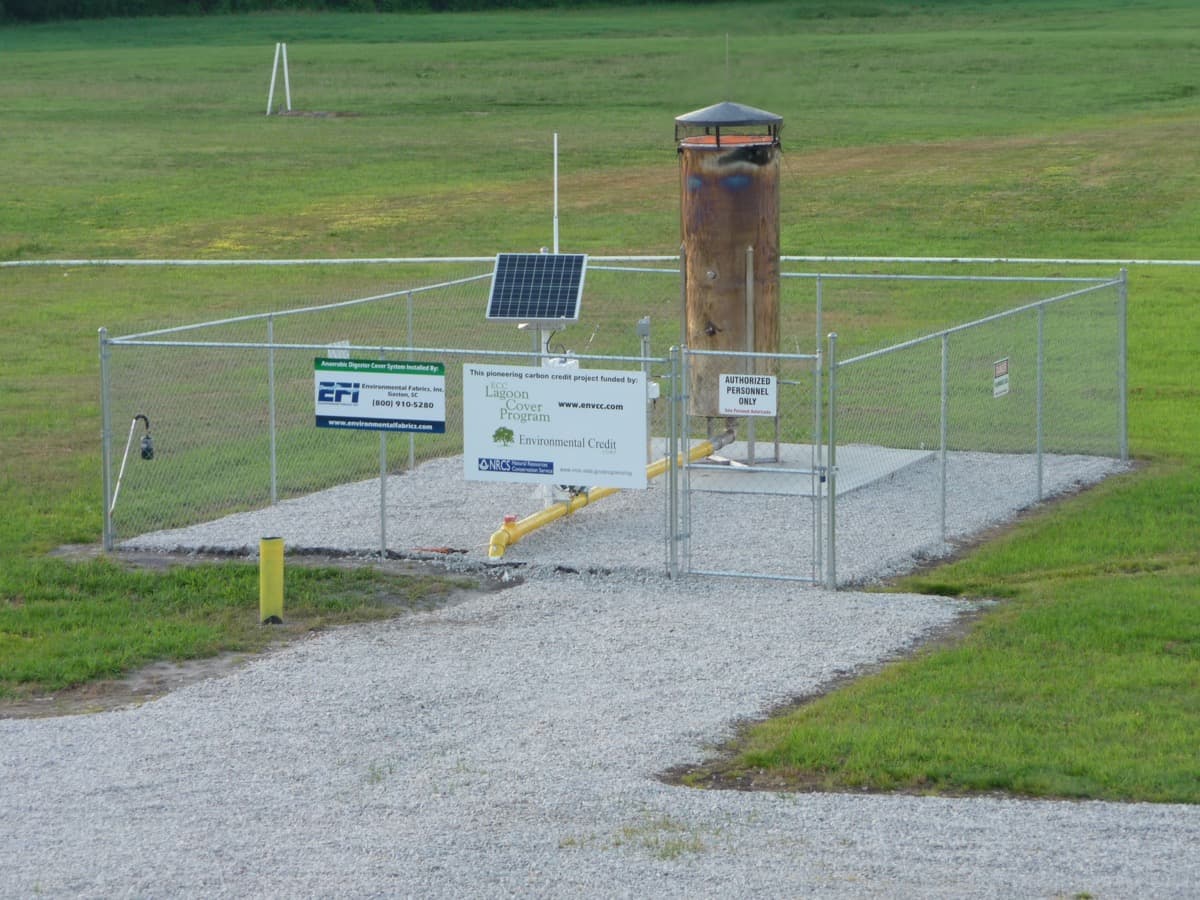
EFI recommends a minimum of two monitoring points for most covered lagoon systems. The first sensor should be on the raw biogas header downstream of the condensate knockout, before any treatment. This is the system's true H2S load and the number that drives treatment system sizing and O2 injection rates. The second sensor should be downstream of treatment, before the end-use equipment (flare, engine, or upgrading system). The difference between the two readings is the treatment system's removal efficiency, and trending that number over time is the single best indicator of treatment system health.
On larger systems with three or more lagoon cells, adding sensors to individual collection laterals helps identify which cells are producing the highest H2S loads. This information is operationally useful: it tells the operator where substrate loading is creating anaerobic conditions favorable to sulfate-reducing bacteria, and where adjustments to feed distribution or mixing might reduce H2S generation at the source.
Reading the Data: Patterns That Predict Problems
Once continuous monitoring is running, the data reveals patterns that inform both day-to-day operations and long-term system management. Several patterns are worth watching for.
A gradual upward drift in baseline H2S over weeks or months typically indicates increasing sulfate loading in the influent. This can result from changes in upstream operations (a new waste stream, seasonal crop processing, or a shift in animal diet) or from sludge accumulation reducing effective lagoon volume and concentrating sulfate. The appropriate response depends on the cause, but early detection through monitoring gives the operator time to investigate rather than discovering the problem through equipment failure.
Sudden spikes lasting two to eight hours, followed by a return to baseline, usually indicate slug loading events. In food processing applications, batch discharges of high-sulfur wastewater are the most common cause. In agricultural systems, seasonal changes in feed ration composition can introduce higher sulfur loads. If these spikes are predictable (tied to a known discharge schedule), O2 injection rates can be adjusted proactively.
A declining removal efficiency between the raw gas sensor and the post-treatment sensor, with raw gas H2S remaining stable, points to treatment system degradation. For O2 injection systems, this usually means the Thiobacillus bacteria colony on the cover underside is stressed. Common causes include excessive condensate washing away the bacterial biofilm, insufficient O2 delivery due to a partially clogged injection line, or a shift in gas flow patterns that bypasses the biologically active zone.
Integration with O2 Injection Controls
Continuous H2S monitoring becomes most valuable when it feeds directly into the O2 injection control system. Rather than running the O2 blower at a fixed rate, a feedback loop adjusts injection based on the measured H2S in the treated gas stream. When H2S rises, injection increases. When H2S drops, injection decreases. This responsive approach maintains consistent gas quality while avoiding over-injection, which wastes energy and can inhibit methane-producing archaea.
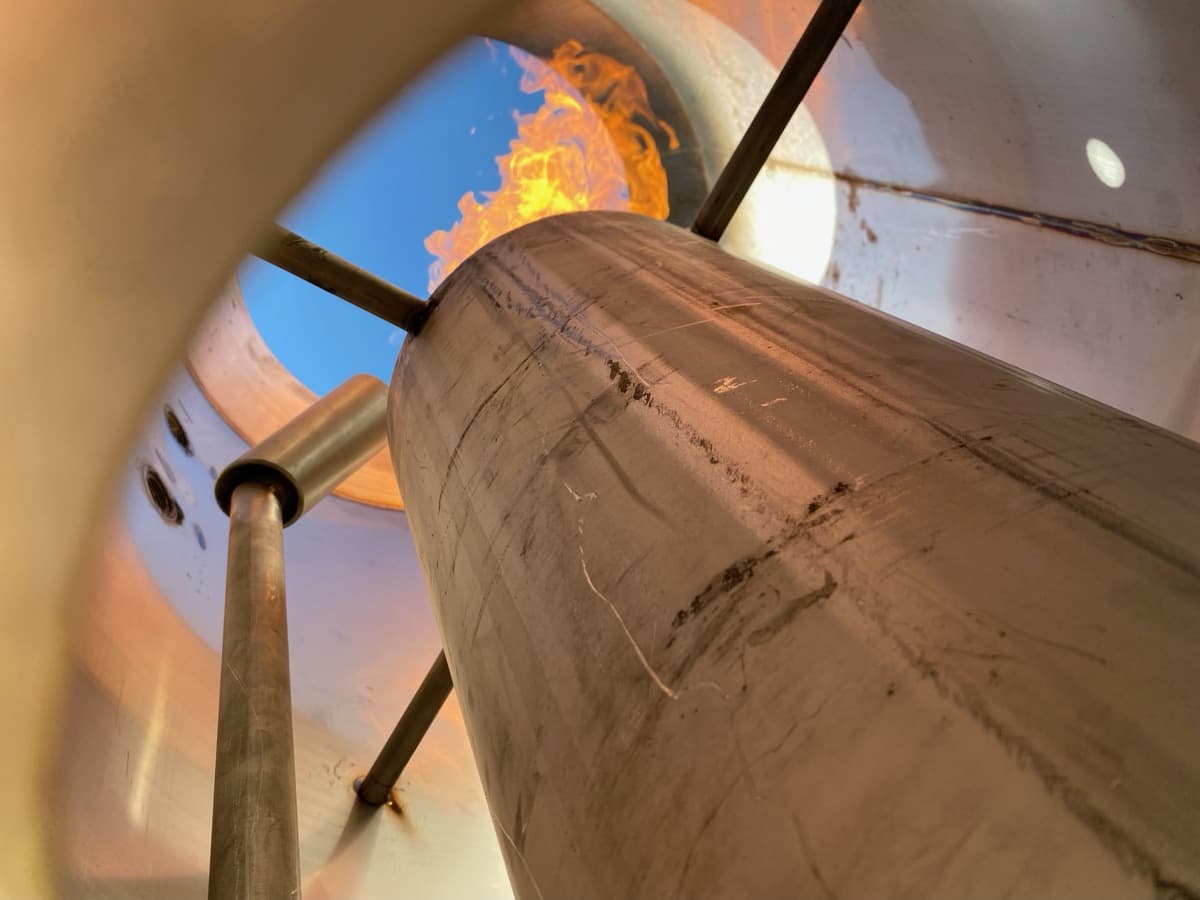
EFI's O2 injection skids are designed to accept a 4-20 mA input from an H2S analyzer, allowing direct integration. The control logic is straightforward: maintain treated gas H2S below a setpoint (typically 200 ppm for flare applications, 50 ppm for engine applications) by modulating blower speed or valve position. This closed-loop approach replaces manual adjustment with automated optimization and reduces operator workload on remote sites.
What It Costs and What It Saves
A basic two-point continuous monitoring system using MOS sensors, a data logger, and cellular telemetry for remote access runs $3,000 to $6,000 installed. Annual maintenance including sensor calibration and occasional replacement adds $500 to $1,000. For context, a single undetected H2S excursion that damages a flare igniter, corrodes a gas compressor impeller, or fouls an engine catalyst can easily cost $10,000 to $50,000 in repairs and downtime.
The return on investment is not abstract. Operators who install continuous monitoring consistently report that they catch problems days or weeks earlier than they would have with periodic sampling. That lead time translates directly into avoided repair costs, reduced downtime, and longer equipment life. For projects where carbon credit revenue depends on continuous flare operation, even a single avoided outage day can pay for the monitoring system several times over.
EFI designs and installs continuous H2S monitoring systems as part of our covered lagoon and biogas collection projects. For existing systems that need monitoring added, we offer retrofit packages that integrate with our O2 injection controls. Contact us to discuss the right monitoring configuration for your operation.