Roughly 40% of the covered lagoon digester inquiries EFI receives each year come from operators who have already been told a project "makes sense" by someone selling them equipment. The operator wants a second opinion. In most cases, the project does make economic sense. But the assumptions behind the numbers vary wildly depending on who built the model, and which variables they chose to emphasize.
After 500+ CLD installations over three decades, EFI has watched projects pay back in 18 months and projects that took seven years. The technology is the same. The lagoons are similar. What separates the two outcomes is a short list of economic drivers that are knowable before a single yard of liner is installed.
The Four Variables That Determine CLD Economics
Every covered lagoon digester project comes down to four inputs: waste volume and organic loading, gas utilization pathway, applicable credit or incentive programs, and installed capital cost. Everything else, including operating expenses, maintenance schedules, and cover replacement timelines, is secondary. Those costs matter, but they rarely make or break a project. The four primary variables do.
Waste volume and organic loading determine how much biogas the system produces. A dairy lagoon receiving flush water from 2,000 cows generates a fundamentally different gas profile than a food processing lagoon handling high-strength organic waste from a cheese plant. Both can support a CLD, but the revenue potential per dollar of capital invested is not the same.
Gas Utilization: Destruction vs. Recovery
The single largest factor in CLD economics is what happens to the gas after it is captured. There are three primary pathways, each with a different financial profile.
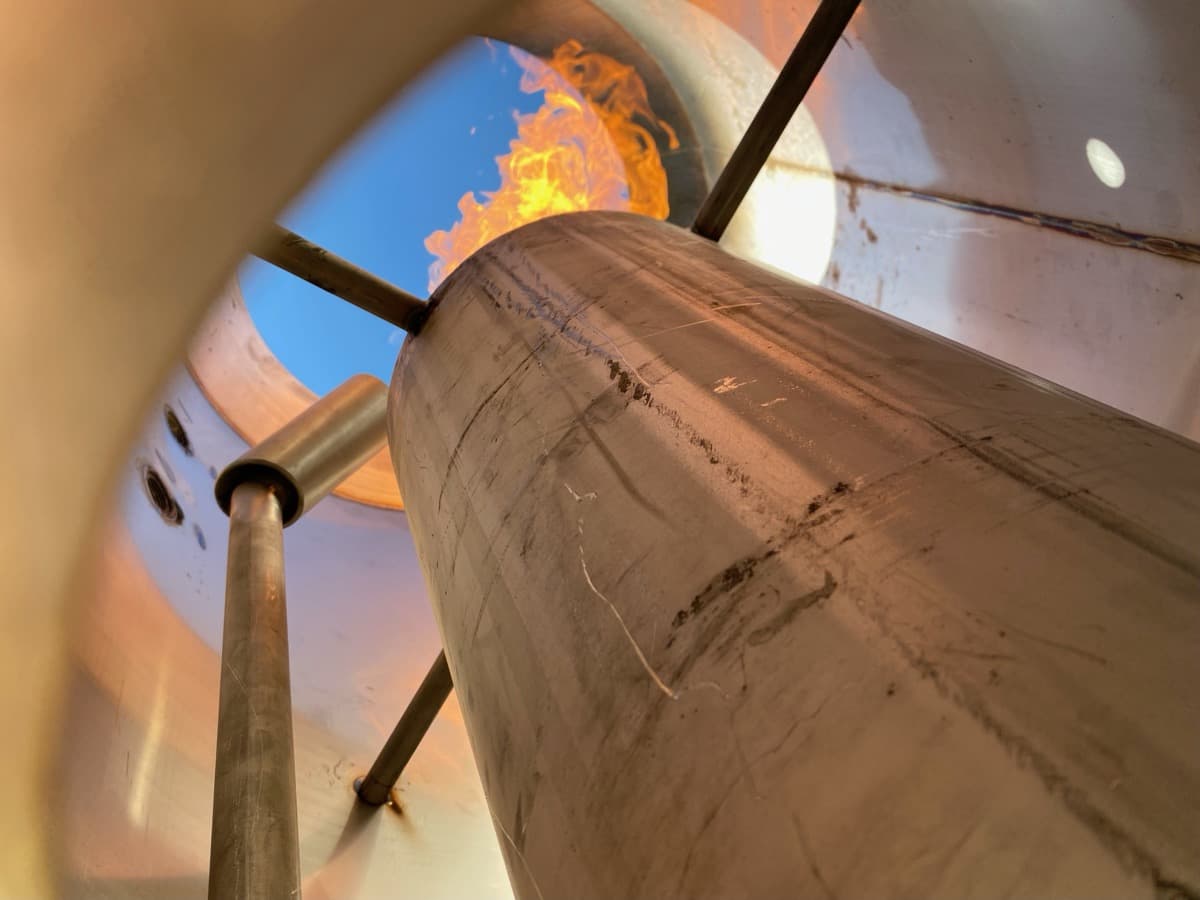
Methane destruction via flare is the simplest and lowest-cost option. The captured biogas is routed to an enclosed flare and combusted. Revenue comes from carbon credits generated by the verified destruction of methane that would otherwise have entered the atmosphere. Capital requirements are modest because the downstream equipment is straightforward. For operators who want compliance and carbon credit revenue without the complexity of energy recovery, this is often the best path.
Electricity generation uses the biogas to fuel an engine-generator set. This adds capital cost and operational complexity (engines require maintenance, fuel treatment, and interconnection agreements), but it also adds a second revenue stream. The economics depend heavily on local electricity rates and interconnection costs. In regions with high retail electricity prices, on-site generation can meaningfully improve project returns.
Renewable natural gas (RNG) upgrading is the highest-revenue but also the highest-capital option. Biogas is cleaned, compressed, and injected into a natural gas pipeline as RNG, which qualifies for federal RIN credits and state programs like California's LCFS. RNG projects can generate substantial revenue, but they require gas cleanup equipment, pipeline interconnection, and ongoing compliance monitoring. The CLD itself represents a relatively small fraction of total RNG project cost.
Credit and Incentive Programs
Carbon credits, renewable energy credits, and state incentive programs are often what push a CLD project from marginal to highly attractive. The specific programs available depend on location, waste type, and gas utilization pathway.
Voluntary carbon markets compensate operators for verified methane destruction. The value of these credits fluctuates with market conditions, but for dairy and swine operations with high methane baselines, the revenue can be significant. EFI's cap-and-flare program, where EFI finances and installs the system at zero cost to the waste generator, is built entirely on this model. The operator contributes the lagoon and the waste stream. EFI contributes the capital and construction expertise. Revenue is shared after EFI recovers its investment.
State programs add another layer. California's LCFS, Oregon's Clean Fuels Program, and similar state-level initiatives provide additional credit value for projects that reduce methane emissions or produce renewable energy. Federal programs, including USDA REAP grants and IRA tax credits, can offset 25% to 40% of installed capital cost for qualifying projects.
Capital Cost: What Actually Drives the Number
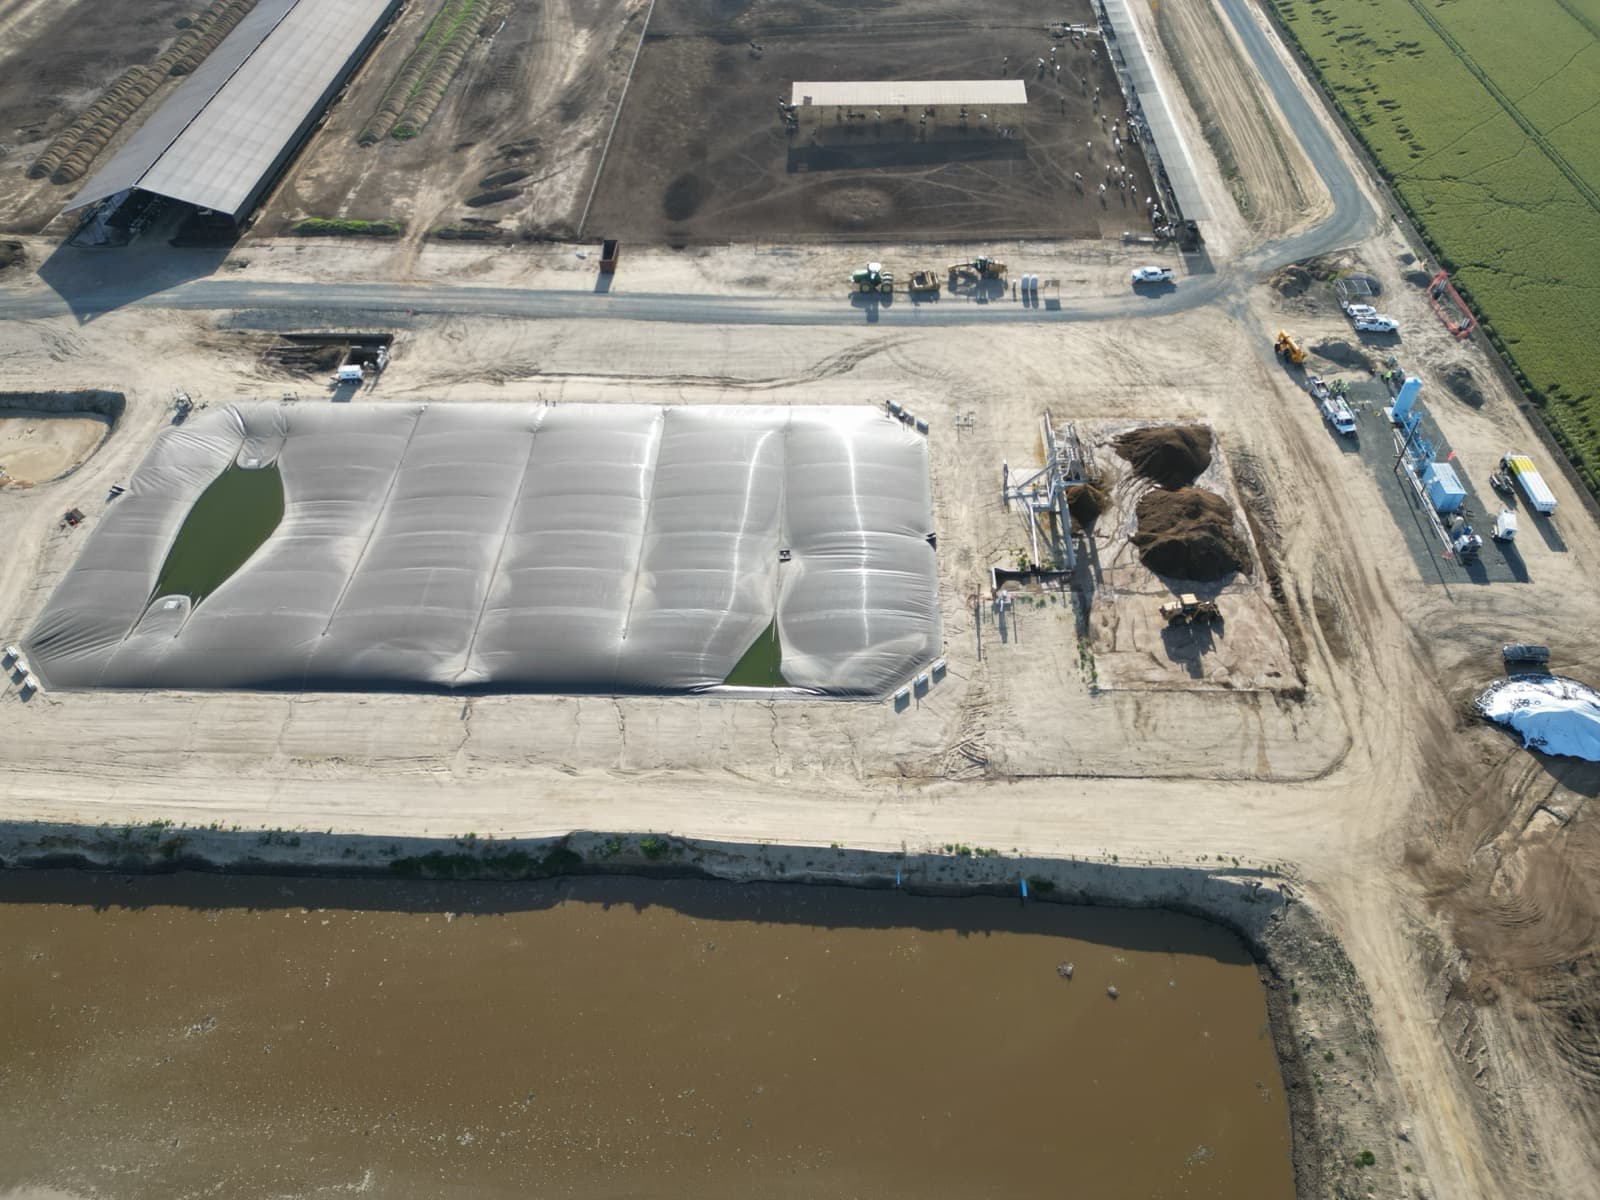
The installed cost of a CLD system is primarily a function of lagoon surface area, site access and soil conditions, cover material specification, and gas collection complexity. A straightforward rectangular lagoon with good perimeter access and stable soils will cost less to cover than an irregularly shaped lagoon with soft banks and limited equipment access. These factors are all assessable during a site visit.
One common mistake in early-stage project evaluation is comparing CLD capital costs to reactor-based digesters (CSTRs) without accounting for the infrastructure that CLDs do not require. A CLD works with the lagoon that is already in the ground. There are no concrete tanks to pour, no heating systems to install, no mixing equipment to maintain. The capital comparison is not cover cost vs. reactor cost. It is total installed system cost, including civil works, against the same metric for a reactor.
Operating Costs Over a 20-Year Life
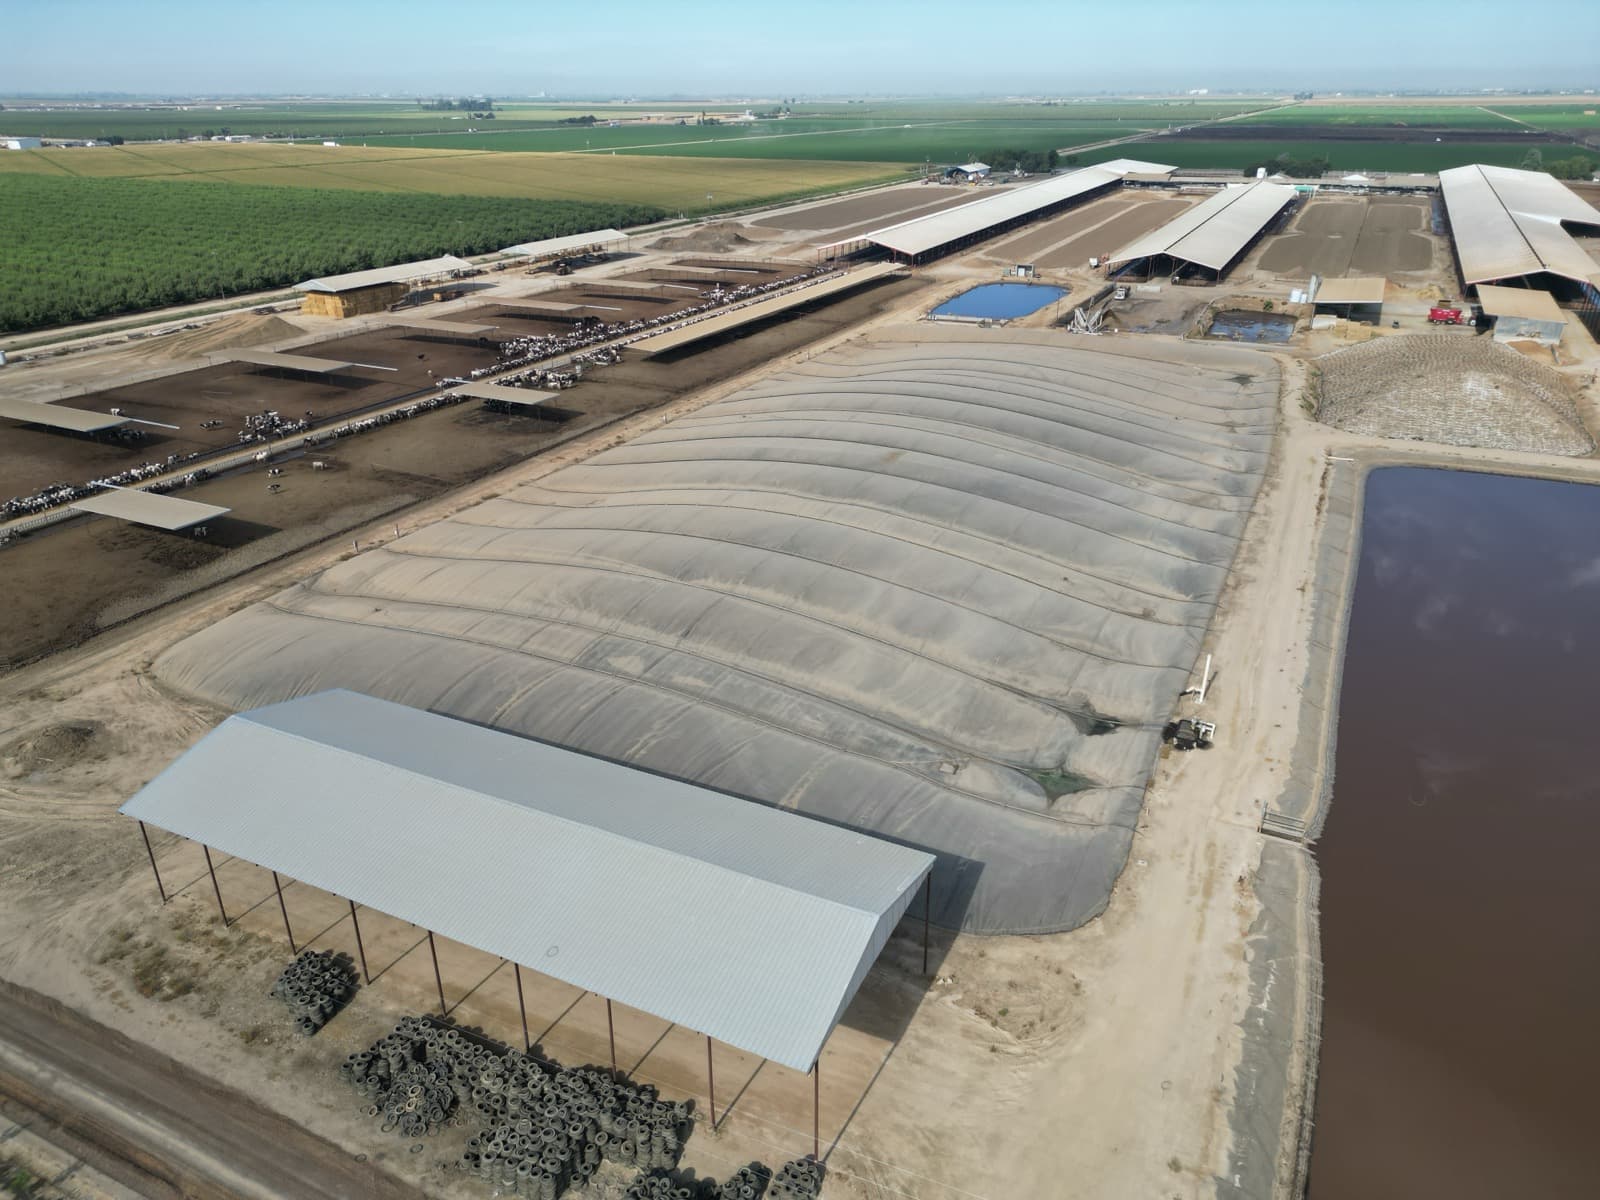
CLD systems have low operating costs relative to other anaerobic digestion technologies. There are no moving parts in the digestion process. The cover sits on the lagoon surface, biogas migrates to the collection system by pressure differential, and condensate is managed passively or with simple pumps.
Routine maintenance includes cover inspections (typically quarterly), rainwater pump servicing, flare or engine maintenance, and periodic gas system checks. Most CLD operators budget between $15,000 and $50,000 per year for O&M, depending on system size and gas utilization equipment. For comparison, CSTR systems commonly require $200,000 or more in annual O&M due to mechanical mixing, heating, and biological process management.
Cover replacement is the largest single maintenance expense over the system's life. HDPE covers typically last 20 to 25 years before replacement is warranted. EFI's oldest installations have covers that are still performing after 30 years, though this is not typical and depends on UV exposure, chemical environment, and maintenance history. Budgeting for one cover replacement over a 30-year project life is a reasonable planning assumption.
How to Evaluate a Project Before You Commit
The most reliable way to evaluate CLD economics is to work backward from the gas. Start with a realistic biogas production estimate based on actual waste characterization data, not theoretical yields from a textbook. EFI maintains a proprietary database of biogas production data from hundreds of operating CLDs across different waste types, climates, and lagoon configurations. That dataset is more predictive than any theoretical model.
From the gas estimate, model the revenue for each utilization pathway. Apply current credit values conservatively. Layer in applicable incentives. Subtract installed capital cost and projected O&M. The result is a project-specific financial model that tells you whether the project works, which pathway maximizes returns, and how sensitive the outcome is to credit price fluctuations.
EFI provides this analysis at no cost during the site assessment process. For operators considering a CLD, the assessment produces a biogas production estimate, a preliminary system design, and a financial model comparing destruction, generation, and RNG pathways. The goal is to give the operator enough information to make a confident decision before any capital is committed.
“The covered lagoon is almost always the right technology for the application. The question is which revenue model fits the operator's goals and risk tolerance. That is what the economics analysis is really about.”
-- Griff Walker, EFI USA